I wanted to better understand how systems research evolved over time. Therefore, I started looking into five conferences (OSDI, NSDI, ATC, SOSP, EuroSys) and visualised a few statistics. The timeframe is from 2006 to 2025 and the analysis is based on the DBLP bibliography dump (4,654 papers across 84 conference editions).
1 · Papers over time
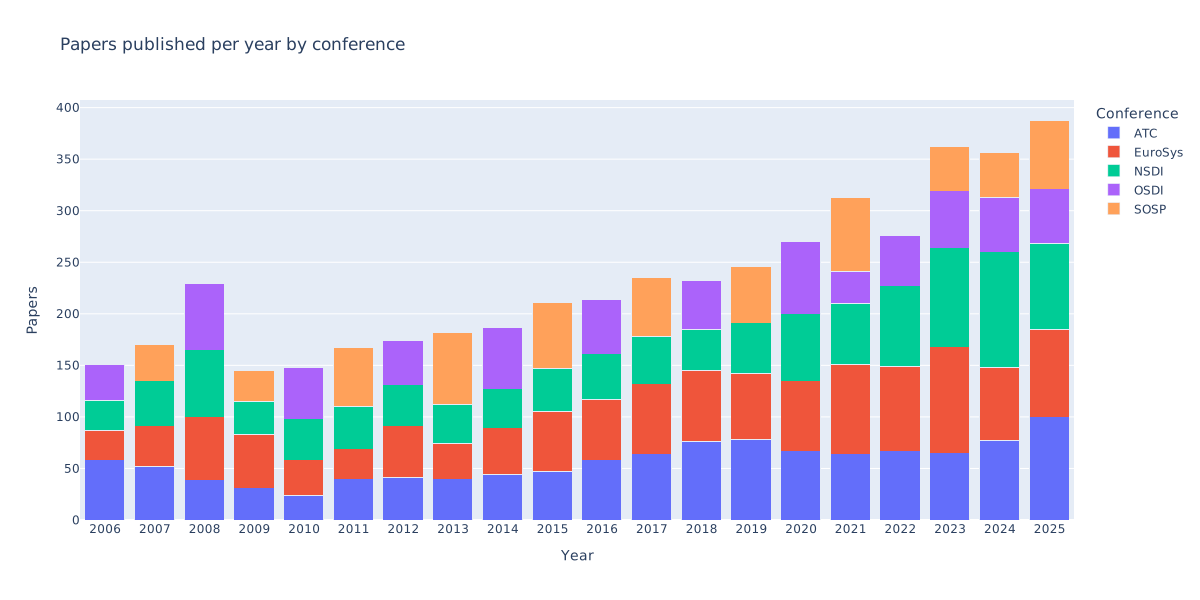
To see how the number of publications changed over time, I plotted a stacked bar chart showing the total number of accepted papers per year for each conference. You can see that the number of publications doubled within the last 20 years. Notably, what happened in 2008? Why did so many papers get published that year?
2 · Paper title keyword heatmap
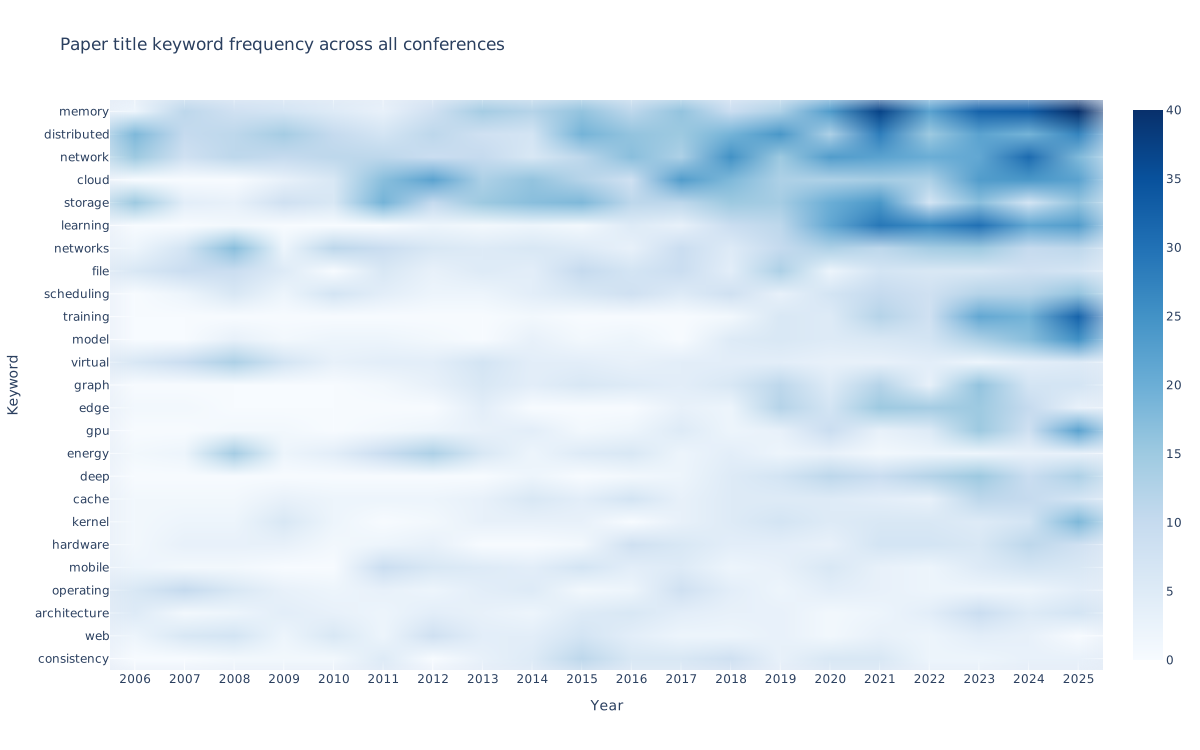
A heatmap of how frequently individual keywords appear in paper titles tells us how the topics changed over time. Rows are the top-25 most frequent keywords. For this figure, there is no single standout insight, but the shift in vocabulary is visible.
Aggregation
For each year, words are extracted from paper titles. The top-25 words by total count across all years are selected as rows.
3 · Topic trend lines
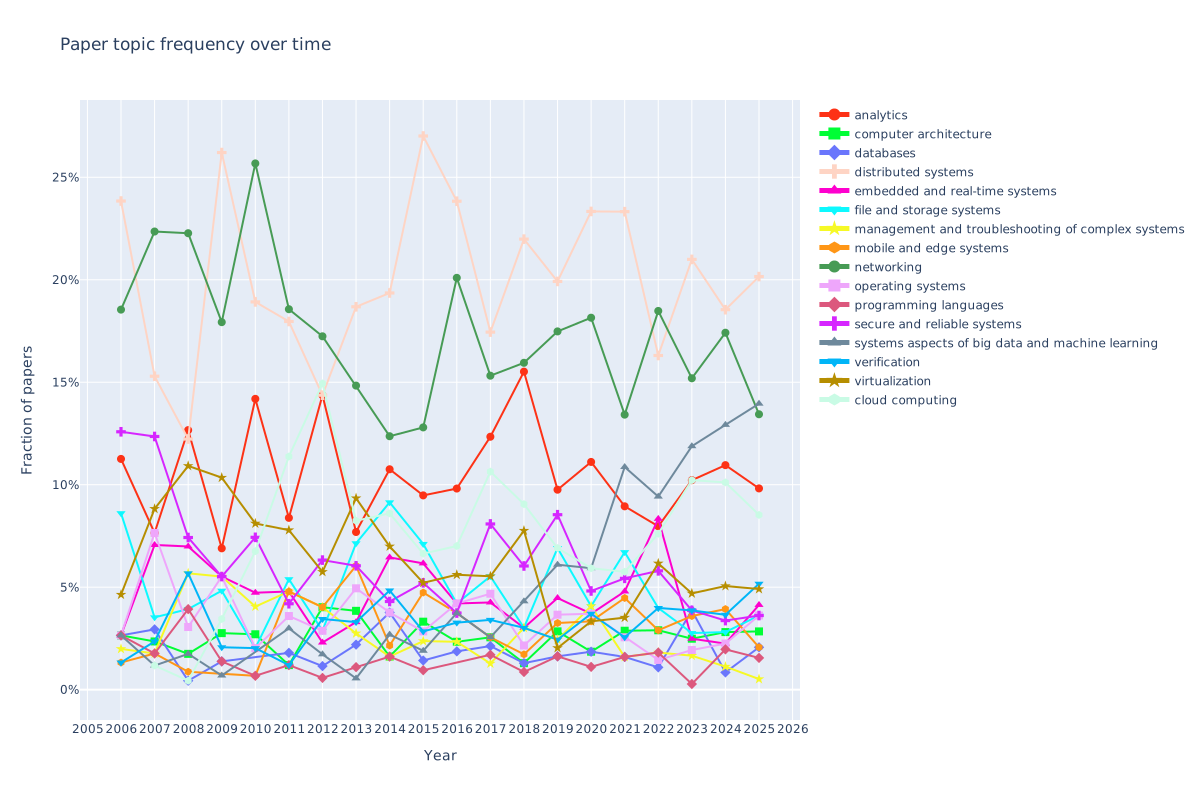
For a pre-defined topic list (SOSP 2026 topics), I wanted to see how the distribution of topics changed over time. The distribution looks fairly stable except that ‘systems aspects of big data and machine learning’ goes from 0 % to 15 %, as one might expect.
Methodology
I use an embedding model to encode paper titles and topic names with google/embeddinggemma-300m. The assignment for each paper is determined by cosine similarity against all 16 topic vectors. The paper is assigned to the topic with the highest similarity score.
4a · Determinism or deterministic in paper titles
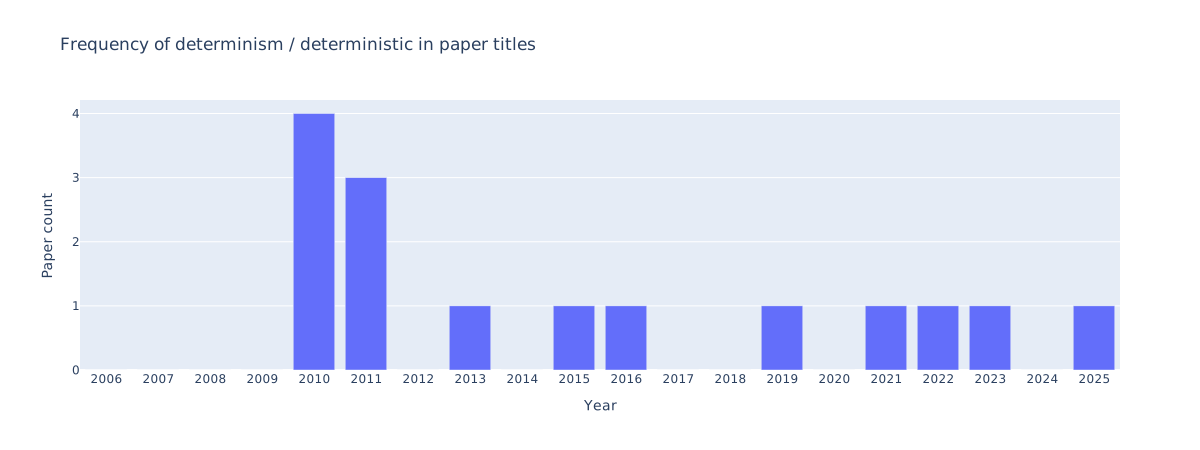
Based on a request by my colleague, we wanted to know how much interest in deterministic systems there is. Therefore, we counted the paper titles containing the words determinism or deterministic in each year. 2010 and 2011 were peak determinism.
4b · AI-related keywords in paper titles
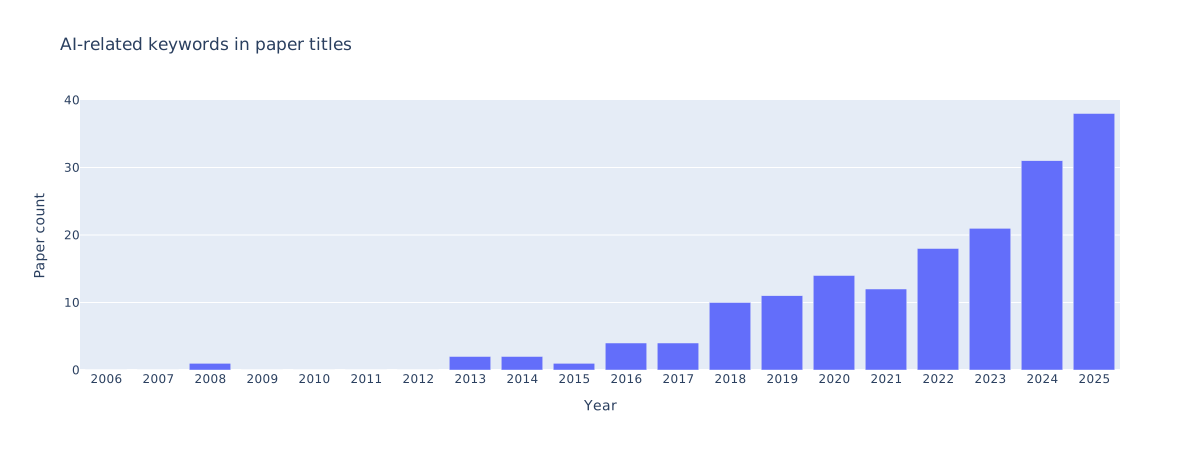
Similar to the previous figure, we wanted to see the numbers for the elephant in the room, AI. A bar chart counting how many paper titles contain AI-related keywords — machine learning, deep learning, artificial intelligence, neural network, LLM, ML, DL, or AI — in each year. The figure suggests exponential growth, so let’s see when we are hitting the ceiling.
5 · Conference topic-overlap
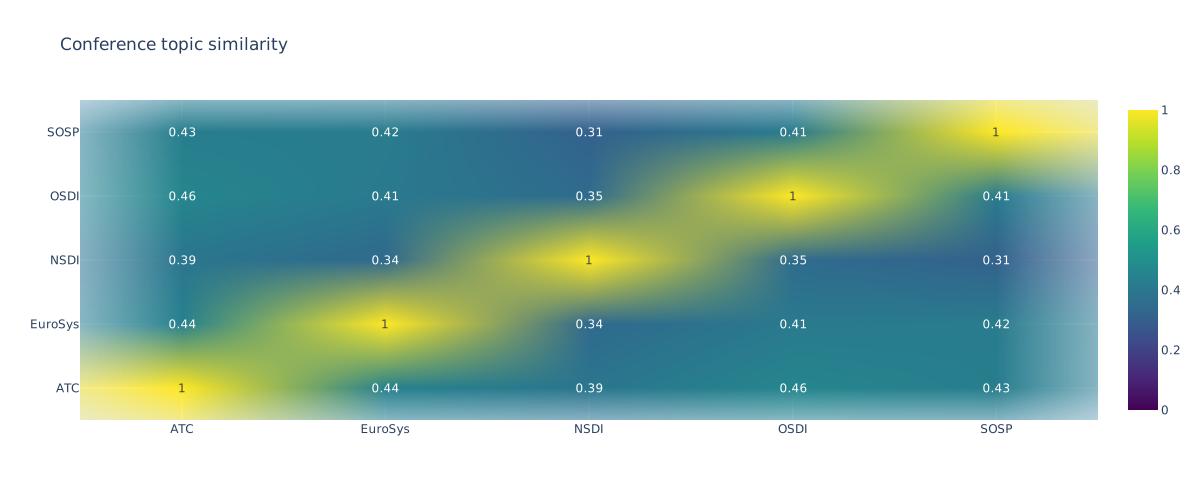
To see the overlap between the conferences, I plotted a symmetric heatmap showing how similar each pair of conferences is in terms of the vocabulary used in their paper titles.
Methodology
For each conference, the top-200 most frequent words across all its paper titles (after generic-word filtering) form a word set. Pairwise Jaccard similarity is computed as the Jaccard index, where a value of 1.0 means the two conferences use identical top-200 words and 0.0 means no overlap. The diagonal is always 1.0 (a conference compared with itself).